Canopy IQ Podcast
Welcome to the Canopy IQ Podcast. Tune in as expert voices and special guests from a wide range of disciplines help guide our understanding of the ways business intelligence, branding, machine learning and digital advertising are reshaping AgeTech in the 21st century.

Read More


Argentum 2023
Canopy founder Bobby Youngs will participate in Argentum’s “Speed to Lead is Key” HR Recruiting Panel on May 9th. More info coming soon!

Read More


The Senior Living Social Media Playbook
Take the guesswork out of your social media campaign strategy with this downloadable guide

Read More
Google Ads: Improving Optimization and Data Visualization
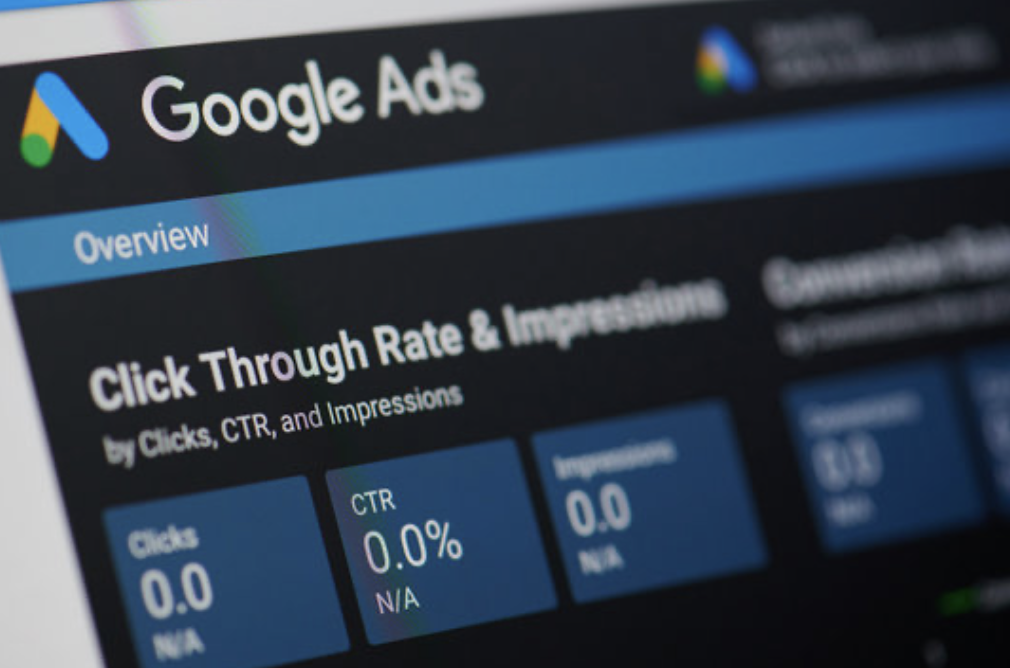
We are obsessed with improving the quality of service we offer our clients. This typically comes in the form of managing the overall performance/health of all campaigns and optimizing the campaign toward the client’s main goals. There are a handful of “core vital” key performance indicators that help us decide how to optimize and justify the changes to leadership. While these “core vital” KPIs (Impressions, Clicks, CTR, Conversions) are critical, they don’t always give us the full picture.
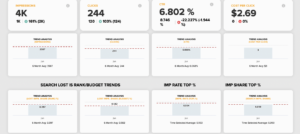
Knowing what’s going on behind the scenes is crucial for campaign optimization and making better decisions. While core vitals show a view of the final results, there is much more data available that can provide valuable insights on how to optimize campaign performance towards your business goals. Impression Share metrics are very informative, show opportunities to improve campaign performance, and highlight what a campaign is lacking or how it is succeeding and improving over time. Utilizing these visibility metrics for campaign health in conjunction with Core Vitals helps give us a much more complete picture of how the ads are reaching their target audience and how the budget is affecting the campaign.
The following graphic is an example of how we are able to visualize the core vital metrics with campaign health metrics in a centralized dashboard. This allows for increased client visibility into PPC performance and allows our specialists to optimize campaigns/tactics more efficiently and effectively.
If the client has placed a higher priority on lead generation, we are able to merge Google Ads conversion data with client’s lead data to show how the campaign is helping their sales funnels and measure lead conversion percentage. This allows more visibility as to how campaign results help achieve business goals.
The following visualization is taken from a live client’s dashboard and shows the merging of client’s lead data with our Google Ads conversion data. From this graphic we can clearly see which Adwords campaigns are helping drive qualified leads. We can also clearly glean from the visual that a strategic change needs to occur within the campaigns of client 3 to drive more qualified traffic.
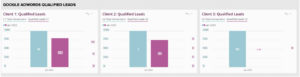
Key takeaway: we are now able to visualize this data set in a central location which is available to the client 24/7 and is consistently updated. This leads to improved transparency and allows us to optimize much faster. At Canopy, continual innovation in the processes we use to provide benefits to clients is paramount.
Learn more about Canopy’s SEM services here: https://canopyadco.com/service/sem/
Learn about High Potential Visitor tracking and the
Canopy advantage for your next Programmatic Display or
Geofencing campaigns.
Get in touch
Canopy advantage for your next Programmatic Display or
Geofencing campaigns.
Get in touch today (704) 396-5525 | info@canopyadco.com