
Connect the Dots and Own Every Step of the Customer Journey
Generate Sales and Drive Engagement With
Best-In-Class Location Based Marketing Tools
Convert Hard To Reach Prospects With High Performing Digital Advertising Strategies

Complimentary Guide
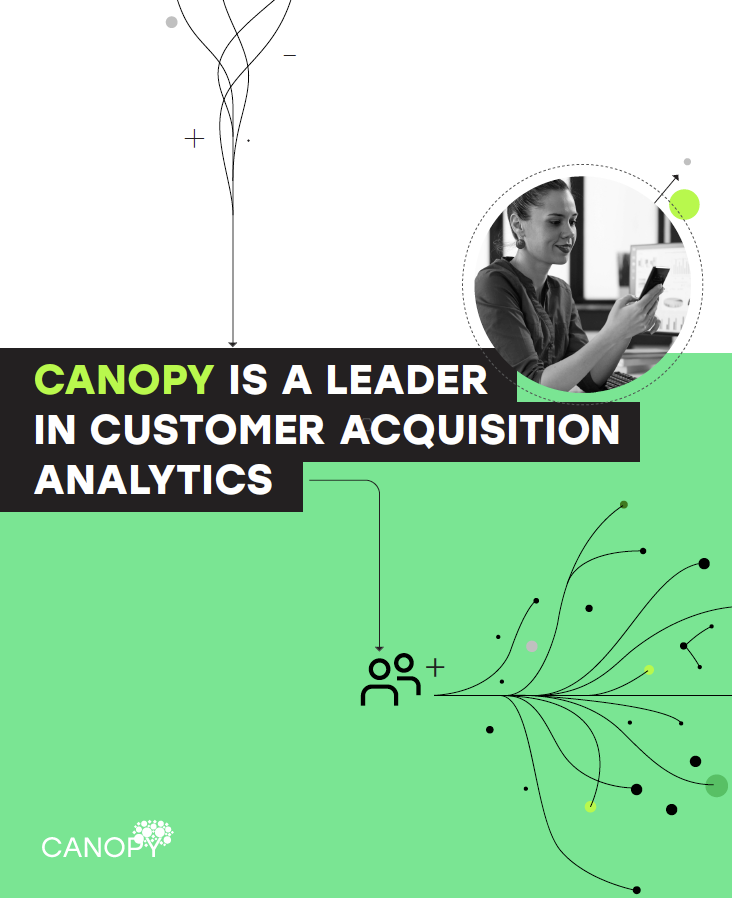
Learn How Predictive Analytics Can Transform Your Marketing Strategy
"*" indicates required fields
Canopy Drives Revenue By Reaching Prospects At Your Unique Point of Interest

Addressable Geofencing Delivers Leads To Fulfill New Development Requirements

Integrated Campaign Increased Showroom Visits in Fifteen States

Segmenting the Washington Post Audience To Maximize Engagement

Implementing an Audience Targeting Plan
Canopy Delivers Healthcare Recruiting Goals in A Highly Competitive Job Market
Campaign Provides New High Quality Leads

Heather Freemont, Senior Vice President, Sales and Marketing, Maplewood Senior Living
“…If you want a highly successful campaign you need the best. I highly recommend Canopy.”
Our Partners In Their Own Words
The value of our partnership with Canopy is beyond words. They're not just consultants; they're collaborators who thrive on data and approach every challenge with a strategic, 'let's get it done' mindset." Our Account Manager, Kayla is like having a strategic partner in the…
The Canopy team is very responsive. We frequently ask for more innovative and custom campaign ideas, and the team always comes back with great ideas that fit our target audience and we see the results.
Digital engagement is an important tool in our efforts to connect individuals experiencing significant barriers to employment with well-paying career opportunities. We appreciate Canopy’s support of our Inclusive Hiring Partners initiative and their efforts to help us reach area job seekers.
The Canopy team helps us achieve consistent and measurable results for our clients. They are highly intuitive, reliable and committed to providing great value
We partner with Canopy because they yield consistently positive results for our clients. Engaging and converting the most qualified Senior Living leads requires a combination of dexterity, creativity and technological expertise, all of which they have in abundance.
Partnering with Canopy yielded a significant and measurable increase in our previous Search and Keyword targeting strategy. In fact the results were so positive that we’ve now expanded our month-to-month campaign scope.
Canopy helped us deliver a highly impressive 0.17% CTR by combining advanced Geofencing and Programmatic display in what was a very challenging campaign. The results speak for themselves.
A key objective was to generate consistent foot traffic for The Hammock Shops Village from summer 2020 through January 2021, which was a major campaign challenge due to Covid. Canopy’s campaign strategy combined Geofencing and Site Retargeting which resulted in more than 2.5k conversions.…
Breaking through on Facebook is extremely challenging, but Canopy incorporated lookalike data and continuous campaign optimization to deliver nearly 45,000 ad impressions and approximately 1,400 unique clicks in less than a month.
A targeted digital strategy is essential when it comes to identifying consumer behaviors and engaging with new and traditional auction customers. Canopy has provided us with digital marketing technology that addresses our needs and the guidance to implement it effectively.
Our collaboration with Canopy and Zgraph generated a 57% Q1 year-over-year increase in organic traffic alone. Their ability to provide customized SEO solutions and keyword search optimization are genuinely impressive.
We need a team that stays on the cusp of new digital developments while super-serving current campaigns with great attention to detail. That’s exactly what we get every day with Canopy.
Combining the diverse talents of Dupree Media, 3rdThird Marketing, Lead InSite, and Canopy has super-powered our online conversion capabilities and yielded tangible high-quality lead generation.
Canopy is a remarkable agency and they know the healthcare industry. If you want a highly successful campaign you need the best. I highly recommend Canopy.
We started out with three of our thirteen community’s digital strategies being run by the Canopy team. After several months of success, we decided to them run all thirteen of our community’s digital strategies.
We’re now able to buy ads at a far better rate which means our clients get actual advertising with better results. We now offer a new level of services without outsourcing an entire digital team.
The Canopy team is laser focused on growing our business at scale. Our account manager regularly provides us with actionable campaign insights using the most relevant conversion data points. Canopy is cost effective while remaining consistently focused on delivering high-converting strategies.

Charlotte, North Carolina Office
4929 Monroe Road
Charlotte, NC 28205

Asheville, North Carolina Office
257 Haywood Road, Suite 201
Asheville, NC 28806

New York Office
4 Garfield Street
Bay Shore NY 11706

